Four facts about the protocol
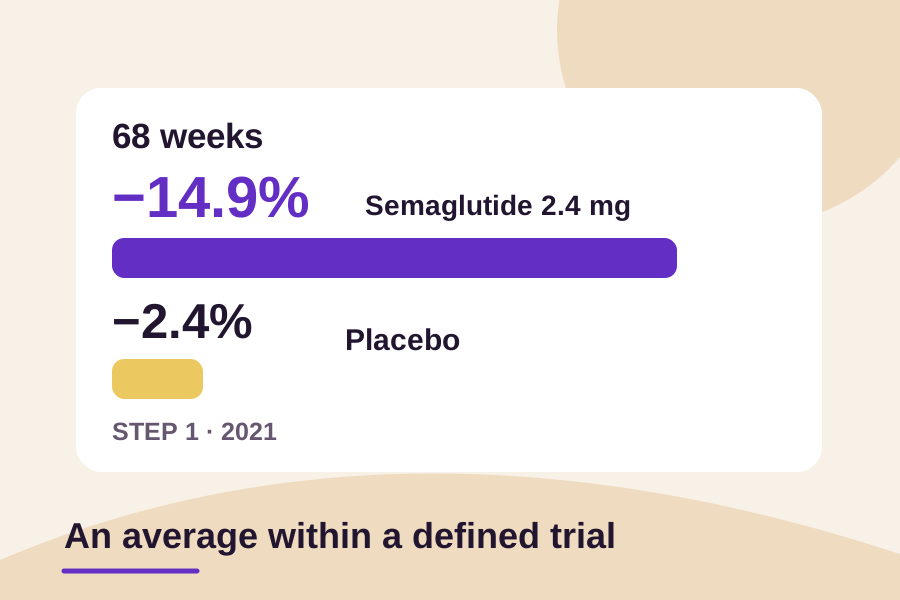
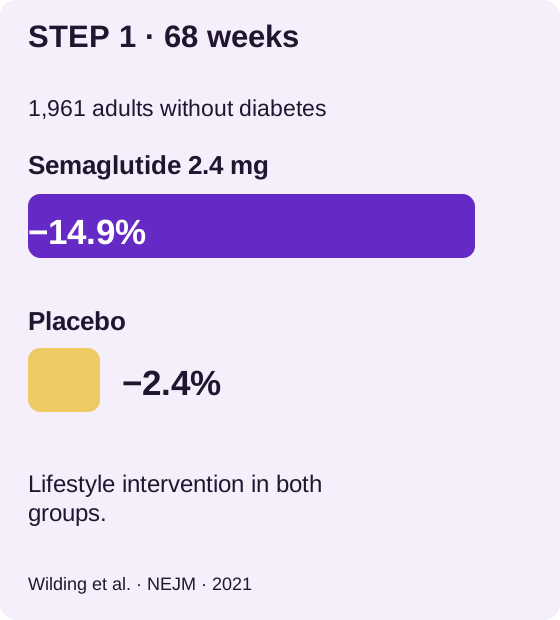
The randomised trial published in 2021 included 1,961 adults with obesity, or overweight and at least one weight-related comorbidity, without diabetes. It compared once-weekly semaglutide at 2.4 mg with placebo, alongside a lifestyle intervention in both groups. The comparison lasted 68 weeks. These details should accompany the result whenever it is reported.
Averages and differences between groups
Average weight change was −14.9% in the semaglutide group and −2.4% in the placebo group. These describe groups with individual variation. Also distinguish the published rounded estimated difference, −12.4 percentage points, from subtracting the displayed numbers, which gives 12.5 points. Statistical estimates use unrounded values and a model; this is not an inconsistency to “correct”.
What the chart does not show
A weight-loss bar alone does not tell you about tolerability, treatment discontinuation or what happens after stopping. The original publication describes digestive adverse effects, among other findings. Benefits and adverse effects need to be read together to assess clinical relevance. Substance, setting and duration should not disappear when a number is shared. Our chart reproduces published averages without extrapolating to your weight.
EXAMPLE / HOW TO USE IT
A critical-reading example
“−14.9%” is not “14.9 kg”, and “at 68 weeks” is not “in one month”. Before sharing a result, record: average percentage, studied population, studied medicine, duration and comparator. If an advertisement omits one of these, return to the publication.
Read the figure text
STEP 1 · 68 weeks · −14.9% · Semaglutide 2.4 mg · −2.4% · Placebo · 1,961 adults without diabetes · Lifestyle intervention in both groups.
Keep this checklist
- Identify the population.
- Read the duration and comparator.
- Distinguish percentages, kilograms and percentage points.
- Read tolerability and limitations too.
Sources and limitations
References consulted for this edition. Studies and documents retain their actual years. Educational examples and documentary procedures, not personal product trials.